By Zach Mohr and Madison Esterle
One of the fundamental problems for local government public budget and finance research in the United States is the availability of audited financial data in a format that is easy to collect and analyze. This is a problem for both researchers that are trying to assemble large data sets and for practitioners that live in states that do not have centralized collection of this data. It is also a problem for cross state data collection, which is quite common for local jurisdictions that live on the borders of states. Undoubtedly, there is much duplication of effort and a great need for local government financial information that is comparable for research and practice.
This blog post presents some basic information that we have collected on the availability of county financial data sources that are collected by states (see table 1 at the end of the blog). This information is provided to supplement other efforts and to make practitioners aware of other data sources outside of their state. It answers a few basic questions. Which states require counties to produce GAAP financial statements? Which states provide centralized collection of county financial data? And what format is the financial data collected by states reported in? We map the answers to these questions and provide some contextual description of the data, which were greatly facilitated by the excellent maps provided by NACO. We are interested in posting this data to have practitioners and others researchers look at the data, use it, and tell us where we might find other such data.
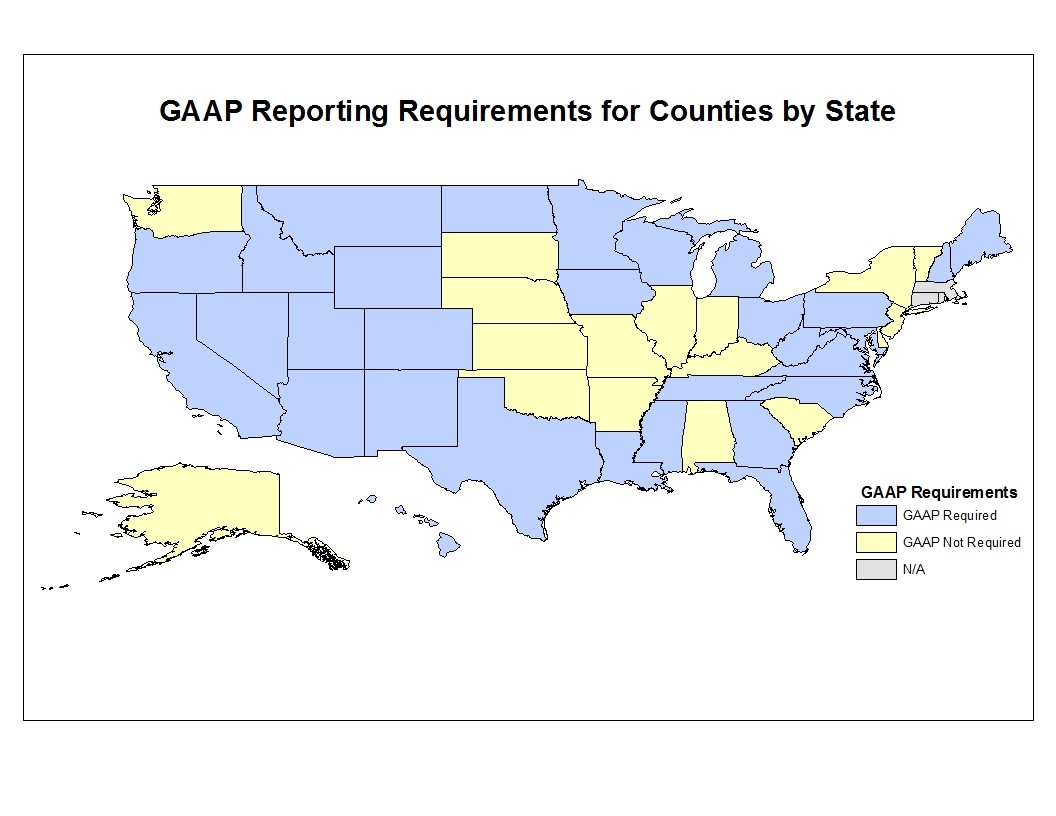
Which states require counties to produce GAAP financial statements?
GAAP financial statements are often required to produce audited financial data that is sufficiently comparable for research purposes. Interestingly, most states (29) currently do not require counties to produce GAAP based financial reports. However, a significant number (17) do not have consistent reporting requirements or reporting requirements that differ from GAAP.
Three states are listed as N/A. This is because this information was substantially based on the NACO financial reporting maps. Also, our map differs from NACO in that we do not recognize Alaska as having consistent financial reporting requirements.
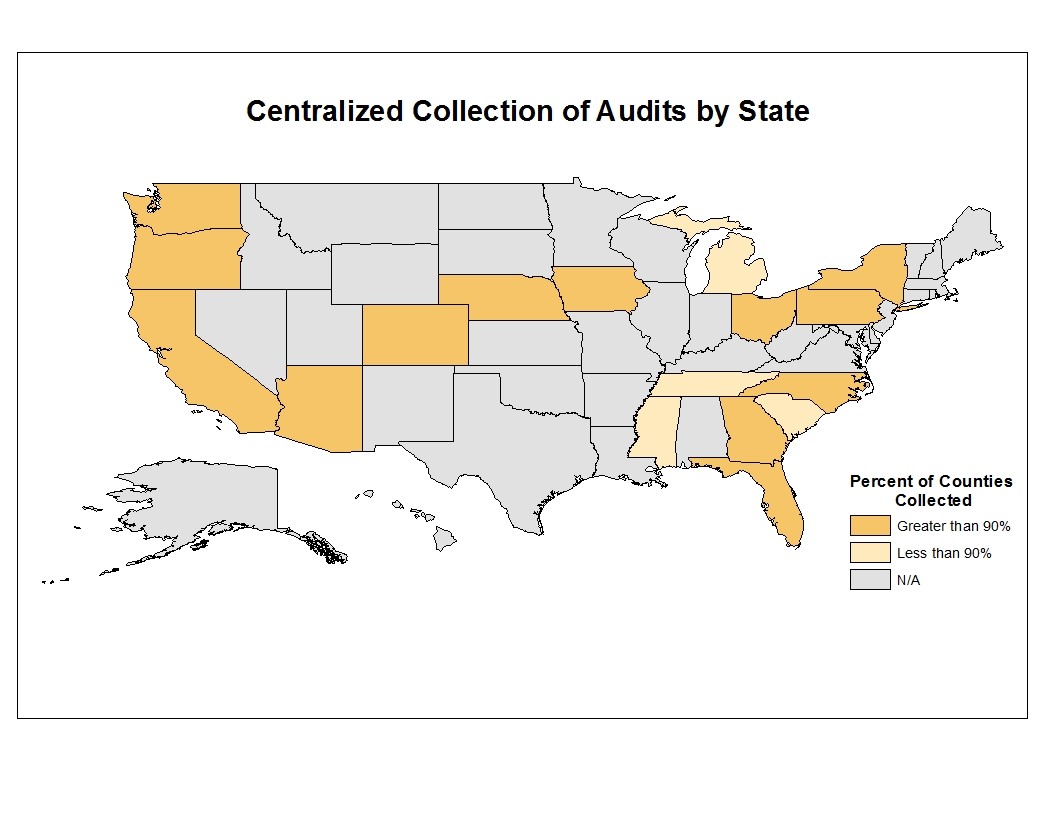
Which states provide centralized collection of county financial data?
For research purposes, we are often interested in states that collect local government financial data as it greatly facilitates the research process. It also greatly facilitates financial transparency as citizens, elected and appointed officials, and other interested parties can compare the spending and financing activities of governments as North Carolina does with its fiscal benchmarking and data collection tools.
Centralized collection happens in seventeen states and of these states (13) collect data on greater than 90% of the counties. Most of these states do not collect county information for the unique counties that have been merged with cities i.e. Denver or San Francisco or entities that are somewhat unique like the boroughs of New York City that function somewhat like counties but are also part of the city. For these purposes, in the spreadsheet at the end of this article, we have broken out the states that collect greater than 90% of their counties and those states that have a centralized collection presence on the web but collect less than 90% of their counties.
What format is the financial data collected by states reported in?
Finally, the format of the centralized financial data is important because it provides easier access to the data and should also provide better transparency and context for the financial comparability of the counties. We find that only five states have centralized collection that allows for easy exporting of the financial data to Excel or csv file formats and of these five only three have a requirement that the counties report GAAP financial statements. Most of the seventeen states provide links to pdfs (12 states). We would like to encourage state and local governments to provide their financial information in formats that assist in data collection and analysis as this can greatly increase financial transparency of local governments.
Conclusion
Researchers and practitioners have great need of financial data. Audited GAAP financial data is the gold standard for comparability purposes. Centralized collection of local government financial statements that are collected in ways that allow analysis like exportable .csv files are also excellent ways to facilitate transparency and analysis.
One of our main reasons for doing this blog post is to increase awareness of county financial data sources. If you know of other sources (like state associations of counties that have historical financial data that are readily and/or freely available), we would like to know about it. If these sources are available on the web, we will update this file in a future blog post. Also, please let us know if we have misclassified a state that you are aware. States can change their reporting requirements and are increasingly trying to provide greater access to local government financial data. The local government budget and finance community of researchers and practitioners can be made significantly stronger by knowledge of comparable financial data sources.
---
*Note this research is funded by the MIT Election Data and Science Lab and its funder, the Madison Initiative of the William and Flora Hewlett Foundation. We also would like to thank Robert Austin for his help in creating the maps.
