Have you ever used the County and Municipal Fiscal Analysis tool that is housed on Treasurer’s website? It allows municipalities and counties in the state to see how they are doing with regard to financial condition and compare their performance to peers. It has recently become the focus of new research coming from colleagues at the University of South Dakota and Indiana University. Ed Gerrish and Luke Spreen presented their research on our benchmarking tool earlier this month at the Public Management Research Conference and it is forthcoming at the Journal of Public Administration Research and Theory. In this Research Review I am going to discuss their research and pull a few findings that are especially notable for those of you that work in budgeting and finance.
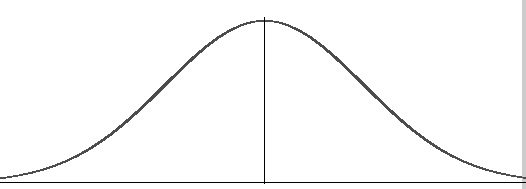
Their paper “Does Benchmarking Encourage Improvement or Convergence? Evaluating North Carolina’s Fiscal Benchmarking Tool” evaluates whether the introduction of our benchmarking tool led to improvements in the performance of local governments or did it lead to some of the lower performing governments doing better and some of the high performing governments doing worse? In that second option, the middle would stay in the middle, because that is fine, but the top may actually decline because they are already the best and doing a little worse will not matter in terms of their benchmarks. Obviously, that is not the preferred outcome. So think about it like this…maybe before the benchmarking tool we had a normal distribution of performance amongst our local governments that looked like this:
Then we adopted benchmarking and everyone moved towards the middle, those far away from the mean (high and low) became more centered. This is good for the bottom, but bad for the top. The new distribution of communities might look something more like this:

The authors find support for convergence rather than improvement. They find that the mean performance of government is essentially unchanged but that poor performers moved toward the mean by improving and high performers moved towards the mean by doing more poorly. So the movement of these two groups offset each other.
In other words, the authors identify star performers, those governments that are in the best financial position. These star performers “appear to slack towards the mean following the introduction of the benchmarking tool…This suggests that those local governments made financial decisions that altered their fiscal position but kept them better positioned than the average government” (Gerrish and Spreen, pg. 29).

The findings of this research are important as we continue to use benchmarking. We need to use it thoughtfully. If the goal is improvement, do not let outstanding numbers make you complacent. We need to be careful about selecting appropriate peers as well.
Abstract:
Several states monitor the fiscal health of their local governments by “benchmarking” them — using a suite of financial indicators to track performance over time. Benchmarking of public organizations can facilitate performance management, leading to the spread of best practices and improved organizational performance. It is also possible that benchmarking, absent other performance routines, could create isomorphic pressures that encourage local governments to adopt policies that converge performance or financial indicators towards the group mean. This paper tests these hypotheses using the introduction of North Carolina’s financial benchmarking tool in 2010. We construct a panel of the 14 indicators used to assess and compare the financial positions of North Carolina county and municipal governments from fiscal year 2008 to 2014. We find support for isomorphism as the dispersion of several indicators declined in the postimplementation period without offsetting beneficial changes in the mean indicator value. These findings pose a dilemma for the quantitative evaluation of both benchmarking and performance management systems; could offsetting changes result in null findings at the mean of the distribution?


Leave a Reply